Introduction
How can disadvantaged and conflict affected communities be restored and put back on a path to lasting sustainability? In Sub-Saharan Africa, investments in Agriculture and Electricity offer a clear pathway to creating measureable socio-economic impact in rural offgrid agrarian communities in the region.
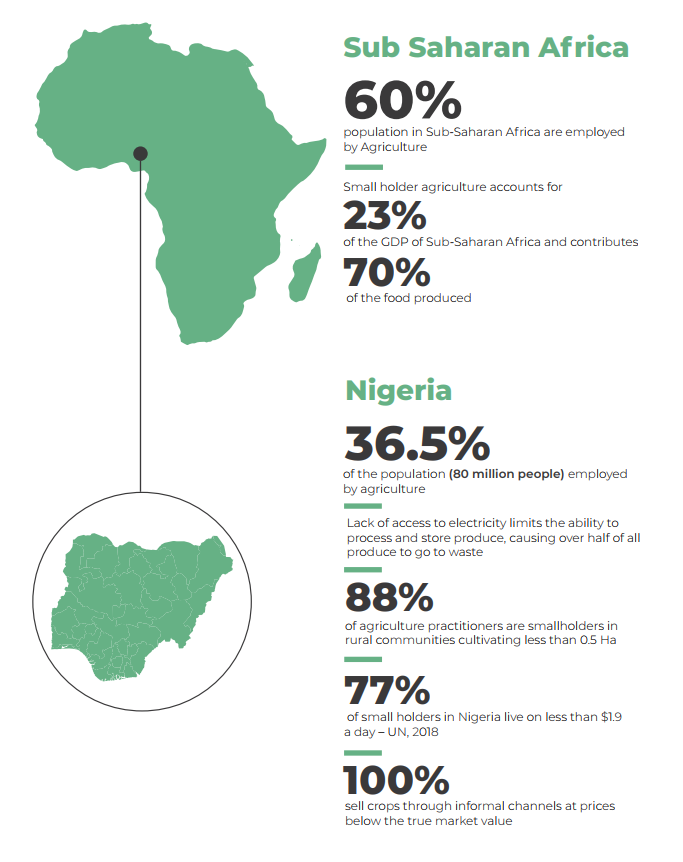
It is a well-established fact that Agriculture is the mainstay of the economy of Sub-Saharan Africa employing over 60% of the population and contributing 23% to the economy of the region (Sakho-Jimbira & Hathie, 2020). In spite of this obvious business case for agriculture in the region, the sector is still unable to meet its huge potentials due to several key factors including:
- Lack of equipment for mechanized farming
- Low access to processing and preservation machines to convert agricultural produce from its raw state to a more valuable state or preserve produce to
- Lack of electricity to power agricultural processing and storage machines
- Inadequate access to markets due to the interior nature of agrarian communities
All of the above factors culminate to keep small holder farmers in state of poverty with most of them living on below $2/day (Food and Agriculture Organization, 2018).
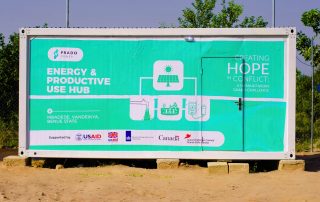
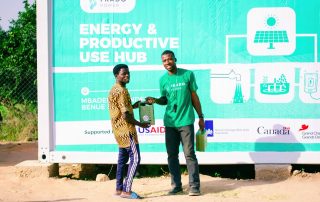
This report below summarizes initial results from a project conceptualized and implemented by Prado Power in collaboration with Farmties under the ‘Humanitarian Grand Challenge: Creating Hope in Conflict’ funded by the USAID, UKAID, and Netherlands Enterprise Agency with support from the Grand Challenges Canada.
ESTABLISHING BASELINES
A user research campaign was conducted through over a period of one month where the prospective users were interviewed. Below is a summary of the current practices in the communities:
Location is an important factor in determining what solution is implemented in each community. For this project, the project team considered other factors to establish the suitability of the communities for the project. Some of the additional factors include:
Regulation has an outsize effect on energy projects and is key to success or failure of a project
The receptiveness of the communities to renewable energy projects in the localities
The willingness of the community to sign an exclusivity agreement committing to a tariff and operational guidelines
A summary of the baseline conditions in the community is shown in Table 1 below:
Table 1: Baseline conditions in the communities
| COMMUNITY | ELECTRICITY ACCESS STATUS | # OF HOUSEHOLDS | # OF SMALL HOLDERS IN THE COMMUNITY | WATER ACCESS | MAJOR CROPS PRODUCED |
|---|---|---|---|---|---|
| Mbadede | Grid is absent. Candles and kerosene lanterns used for basic lighting | 527 | 1581 | Water is partly available from wells about 3km from the cluster | Yam, Cassava, Soy beans, Groundnuts, Oranges |
| Jera Bakari, Adamawa State | Grid is absent. Candles and kerosene lanterns used for basic lighting | 628 | 1884 | Water is obtained from a seasonal stream about 5km from the community | Rice, Maize |
Technology and Equipment
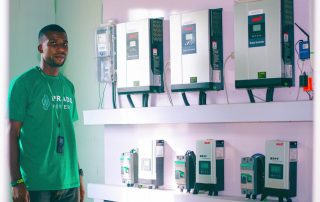
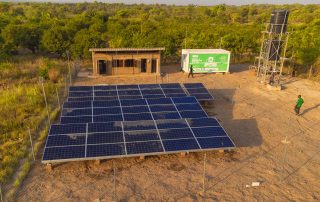
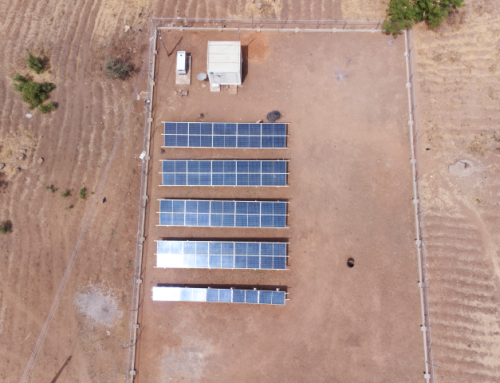
In deciding on the type of technology and equipment to deploy for the project, Prado Power considered the use of modular, scalable and energy efficient equipment that can be easily scaled up when demand increases. Thus Prado Power designed and deployed a solar PV system and some energy efficient equipment to support agribusiness in the communities.
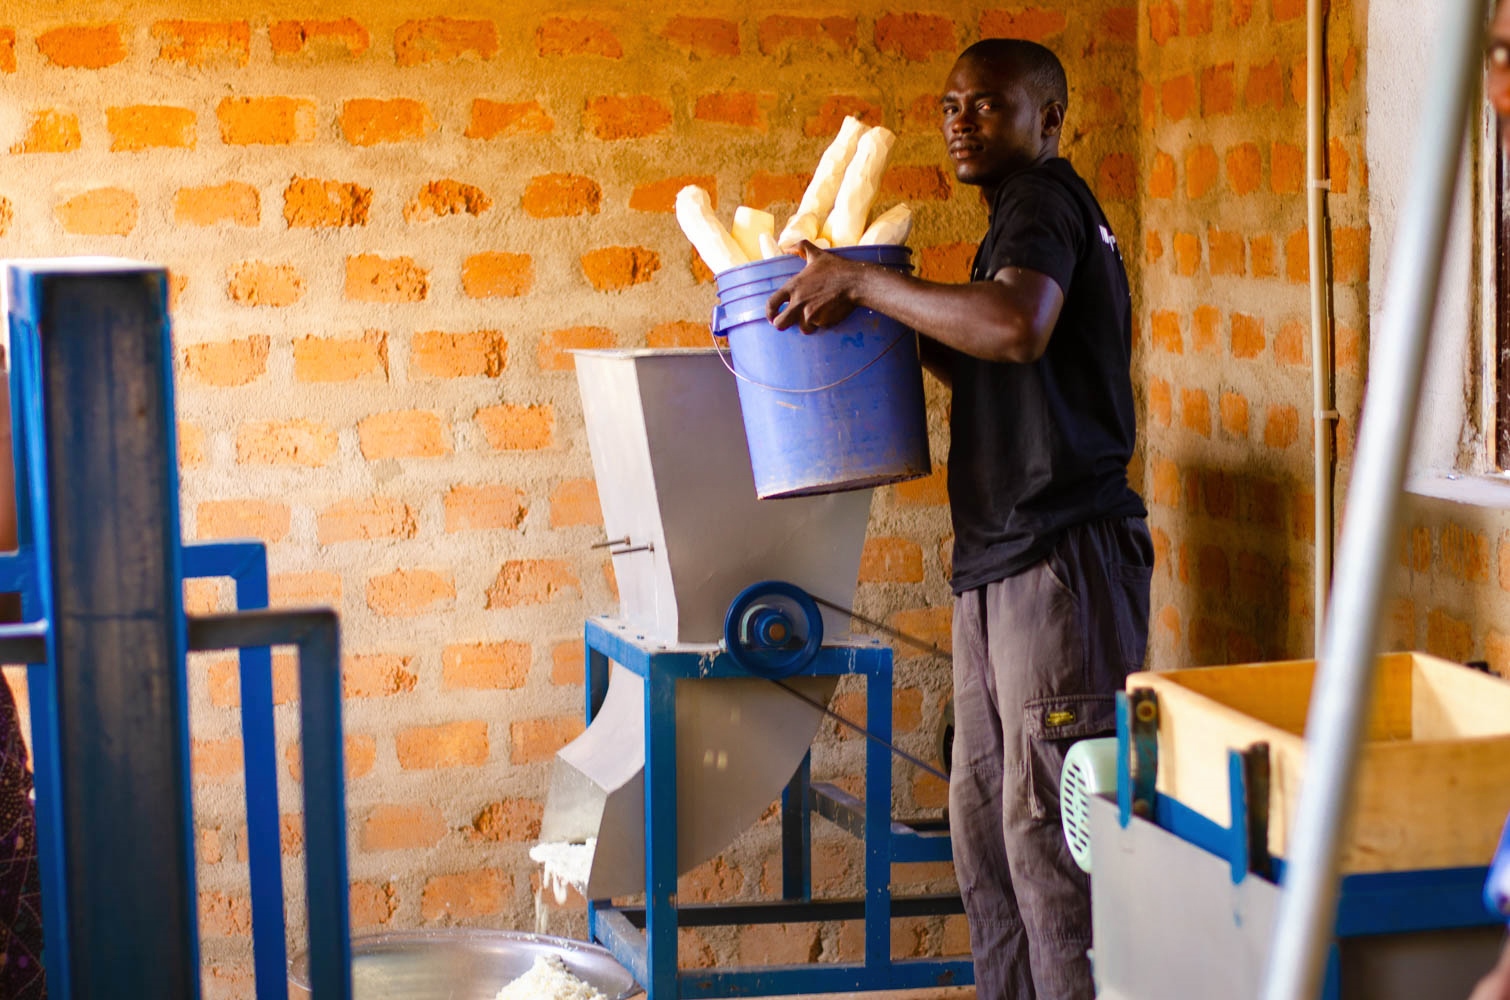
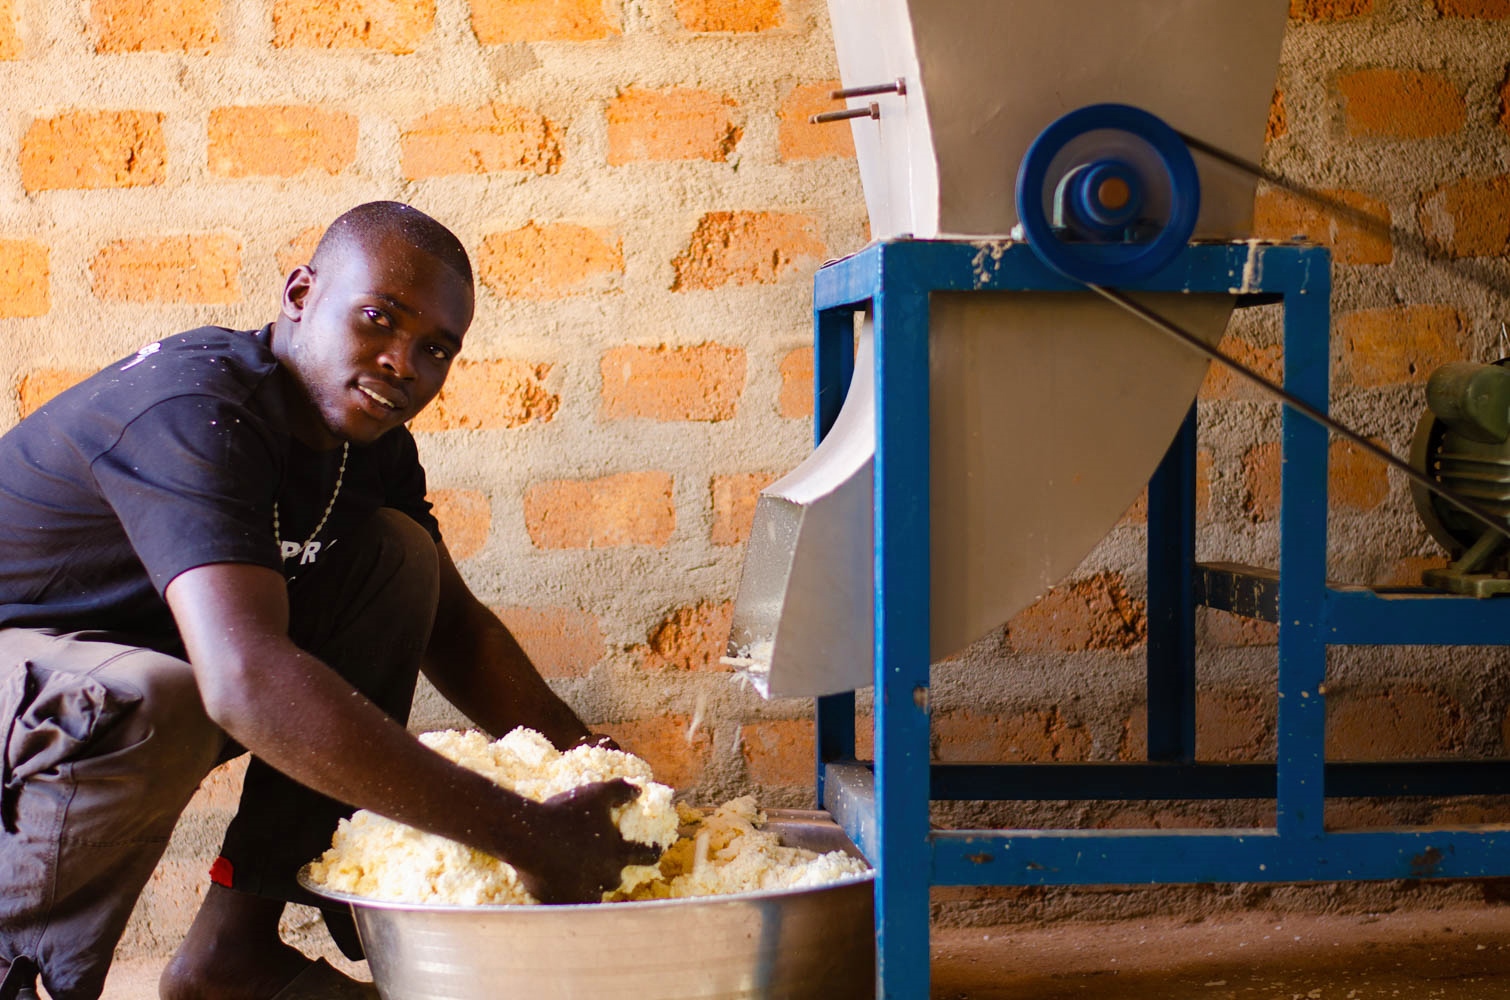
Agricultural processing and storage equipment deployed was to ensure that some form of processing would take place at community level before produce is sold to end users. This in turn would provide valuable jobs for agriculture practitioners in the community, improve the value of produce, and enhance the profitability of agriculture.
Residential and commercial customers living at distance from the hub were provided with Solar Home Systems on a Pay-As-You-Go scheme, while local institutions such as the community school and community hospital were connected to the hub and provided with Solar Home Systems for free.
On the right are equipment deployed across each of the communities.
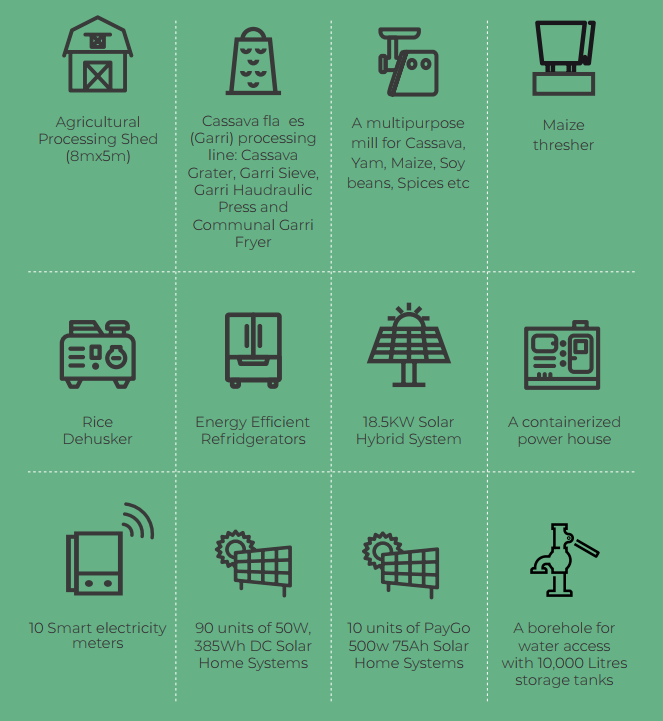
Agricultural processing and storage equipment were procured from a local manufacturer following survey of quantity and type of agricultural produce grown across each of the communities. Table 2 below shows the distribution of agricultural processing and storage equipment.
Table 2: Distribution of agriculture processing and storage equipment
| Community | Equipment Name | Function | Qty | Processing/ Storage Capacity | Power rating (kW) | # of subscribers (2021) |
|---|---|---|---|---|---|---|
| Mbadede, Benue State | Hammer Mill with Cyclone | Multipurpose mill for yam, cassava, soy beans, maize, spices | 1 | 2Ton/Hr | 5.5kW with soft starters | 2160 |
| Cassava Grater | Grates Cassava for Garri | 1 | 1Ton/Hr | 1.5kW | 2160 | |
| Garri Sieve | Sieves Garri | 1 | 1Ton/Hr | 1.5kW | 2160 | |
| Garri Communal Fryer | Commercial Garri frying | 1 | 500kg/Hr | N/A | 2160 | |
| Garri Hydraulic Press | Eliminating liquid content from grated cassava | 1 | 500kg/day | N/A | 2160 | |
| Refrigerators | Storage of milk and meat | 2 | 2x300L | 250W | 2 | |
| Solar powered water pump and storage tanks | Pumps and stores water for irrigation and domestic use | 1 | 5m3/Hr, 10,000L | 750W | 3123 | |
| Jera Bakari, Adamawa State | Maize Thresher | Removes maize from cobs | 2 | 1 Ton/Hr | 1.5kW | 1362 |
| Rice Dehusker | Eliminates rice husks | 2 | 1 Ton/Hr | 5.5kW with soft starter | 1362 | |
| Refrigerators | Storage of milk and meat | 2 | 2x300L | 250W | 4 | |
| Solar powered water pump and storage tanks | Pumps and stores water for irrigation and domestic use | 1 | 5m3/Hr, 10,000L | 750W | 3820 |
GENDER CONSIDERATIONS
The project also embodied a clear gender strategy as the project team looked to break from the cultural norm of women under-representation in community renewable energy projects or economic activities. It was important to set clear gender targets at the inception phase of the project and share details with leaders and member of the communities during stakeholder engagements and town halls. The following gender targets were successfully implemented across both communities:
RESULTS
Solar Home Systems were distributed based on ability to afford. As a result of the level of affordability of the communities the user categories were subjected to the following terms:
A summary of the beneficiaries of the various project components over a period of one month is contained in Table 3.
RESULTS SUMMARY
Table 3: Project Beneficiaries (disaggregated by sex, gender and component)
| Indicator | Indicator description | Indicator Categories | Male | Female | Other | Total |
|---|---|---|---|---|---|---|
| Electricity Access | ||||||
| Number of individuals with electricity access | Individuals who access electricity through Solar Home Systems or Directly from the Hub | Children (0 – 9 years) | 351 | 401 | 0 | 752 |
| Adolescents (10 – 19 years) | 389 | 113 | 0 | 502 | ||
| Adults (20 – 49 years) | 101 | 122 | 0 | 223 | ||
| Adults (50+ years) | 92 | 105 | 0 | 197 | ||
| Access to agricultural processing and storage equipment | ||||||
| Number of small holder farmers with access to productive use equipment from host or neighbouring communities | Individuals that have utilized processing or storage equipment at least once (including individuals from neighbouring communities) | Children (0 – 9 years) | 0 | 0 | 0 | 0 |
| Adolescents (10 – 19 years) | 528 | 423 | 0 | 951 | ||
| Adults (20 – 49 years) | 1127 | 986 | 0 | 2113 | ||
| Adults (50+ years) | 282 | 176 | 0 | 458 | ||
| Water Access | ||||||
| Number of individuals who have accessed water through the productive use hub | Individuals who have come to collect water from the hub at least once | Children (0 – 9 years) | 764 | 417 | 0 | 1180 |
| Adolescents (10 – 19 years) | 833 | 1597 | 0 | 2430 | ||
| Adults (20 – 49 years) | 694 | 2361 | 0 | 3055 | ||
| Adults (50+ years) | 69 | 208 | 0 | 278 | ||
| Market Access | ||||||
| Number of small holder farmers with access to off-takers through the Farm Warehouse App and Web Portal | Individuals that have listed their products or signed up to the Farm Warehouse Application | Children (0 – 9 years) | 0 | 0 | 0 | 0 |
| Adolescents (10 – 19 years) | 0 | 0 | 0 | 0 | ||
| Adults (20 – 49 years) | 0 | 0 | 0 | 0 | ||
| Adults (50+ years) | 0 | 0 | 0 | 0 | ||
| Employment | ||||||
| Number of new Direct jobs created | Number of individuals employed directly by the hub e.g. Machine operators, security personnel, etc | Children (0 – 9 years) | 0 | 0 | 0 | 0 |
| Adolescents (10 – 19 years) | 0 | 0 | 0 | 0 | ||
| Adults (20 – 49 years) | 7 | 8 | 0 | 15 | ||
| Adults (50+ years) | 3 | 2 | 0 | 5 | ||
| Number of new indirect jobs created | Number of individuals employed indirectly (including workers engaged directly for produce peeling, washing, bagging etc) | Children (0 – 9 years) | 0 | 0 | 0 | 0 |
| Adolescents (10 – 19 years) | 6 | 24 | 0 | 29 | ||
| Adults (20 – 49 years) | 65 | 123 | 0 | 188 | ||
| Adults (50+ years) | 47 | 29 | 0 | 76 | ||
PROJECT BENEFICIARIES
The project has recorded the following users to date:
Table 4: User categories
| User Category | Number of users on-boarded (month one) |
|---|---|
| Residential Users | 180 |
| Commercial Users | 20 |
| Productive users (Productive use hub subscribers) | 3552 |
| Water access subscribers | 6943 |
| Column 1 Value 5 | 5 |
FINANCIAL SUMMARY
The Financial returns and projections were modelled across both communities based on the following number of users and user categories that recorded usage in the first month of deployment:
Table 5: Financial summary and projections
| Month | 1 | 2 | 3 | 4 | 5 |
|---|---|---|---|---|---|
| Power sold (kWh) | 3237.50 | 3237.50 | 3237.50 | 3237.50 | 3237.50 |
| Residential | 1039.5 | 1039.5 | 1039.5 | 1039.5 | 1039.5 |
| Commercial | 300 | 300 | 300 | 300 | 300 |
| Productive | 2198.00 | 2198.00 | 2198.00 | 2198.00 | 2198.00 |
| Tariffs ($) | |||||
| Residential Tariff ($) | 0.45 | 0.45 | 0.45 | 0.45 | 0.45 |
| Commercial Tariff ($) | 0.45 | 0.45 | 0.45 | 0.45 | 0.45 |
| Productive Tariff ($) | 0.25 | 0.25 | 0.25 | 0.25 | 0.25 |
| ARPU ($) | |||||
| ARPU Households ($) | 2.60 | 2.60 | 2.60 | 2.60 | 2.60 |
| ARPU Commercial ($) | 6.75 | 6.75 | 6.75 | 6.75 | 6.75 |
| **ARPU Productive | 54.95 | 54.95 | 54.95 | 54.95 | 54.95 |
| Total ARPU/month | 64.30 | 64.30 | 64.30 | 64.30 | 64.30 |
| Average Investment Per User (AIPU) ($) | 28.81 | 28.81 | 28.81 | 28.81 | 28.81 |
| Income | |||||
| Power Sales ($) | 1152.28 | 1152.28 | 1152.28 | 1152.28 | 1152.28 |
| Connection Fees ($) | 560 | – | – | – | – |
| +Productive Use Equipment ($) | 914.29 | 914.29 | 914.29 | 914.29 | 914.29 |
| Water Access | – | – | – | – | – |
| Total | 2626.56 | 2066.56 | 2066.56 | 2066.56 | 2066.56 |
**Refers to average revenue from electricity sales for productive use equipment
+ Refers to income from use of productive agricultural equipment
CONCLUSION
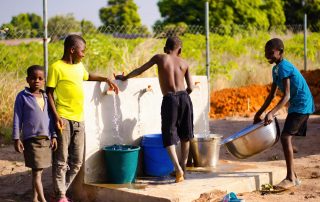
The project has already received acceptance at the community level as well as other levels of government. Water was made available for free at the hub to improve WASH at the communities while providing traffic to advertise the other business activities.
The second phase of the project looks to address some of the additional challenges that the communities have expressed including:
A partnership with agricultural extension firm, Farm Warehouse, has been established to provide e-commerce services for smallholder farmers in rural offgrid communities where Prado Power has established its minigrids and productive use hubs. The company would also provide services such as access to improved seedlings, fertilizers, insurance services, microcredits, temporary storage and electric mobility solutions to convey produce to nearby markets or pick up points.
Due to the resounding success of the solution, Prado Power has been engaged by the governments of Akwa Ibom and Enugu States to replicate the model across 60 communities, while Prado Power has developed a portfolio of projects in rural communities in Niger, Plateau and Borno States where agriculture is prevalent and energy access is largely non-existent.

